Tag History
Feature Description
The Tag History widget is used to display tag historical data retrieved from the Weincloud server. This widget supports single tag or multi-tag mode and provides various data aggregation functions, allowing users to view the historical value changes of tags in table format.
- Single Tag Mode: Display historical data for a single tag
- Multi-Tag Mode: Support up to 30 tag sources, enabling simultaneous viewing of historical data from multiple tags when aggregation is enabled
- Data Aggregation: Support aggregation modes including average, sum, maximum, minimum, median, percentile, count, and more
- Custom Time Format: Provide multiple date-time format options
- Data Download: Export and download historical data
Style Settings
Data Source
Click the "Select Tag" button to set the tag data source to display.
Multi-Tag (Enable Aggregation)
When this option is checked, you can select multiple tags as data sources (up to 30) and enable aggregation to perform statistical analysis on historical data from multiple tags.
Supported Data Types:
- Single Tag Mode: Boolean, Int, Float, String
- Multi-Tag Mode (with aggregation enabled): Boolean, Int, Float
Tag Filter
Enable
When enabled, allows dashboard viewers to interactively select which tag data to display. Use the toggle switch to enable or disable this feature.
Style
Click the "Select Style" button to open the style selector dialog, where you can choose a preset visual style for the tag history widget.
Basic
Background Color
Set the background color of the widget. Click the color picker to open the color panel, which provides:
- Preset color options
- Custom colors
- Transparency adjustment
Title
- Enable: Check the checkbox to display the title
- Title Text: Enter the title content (up to 100 characters)
- When the title is not enabled, related settings will be disabled
Font
Select the font for the title text from the dropdown menu, offering various font options including:
- Default
- System fonts (Arial, Calibri, Helvetica, Times New Roman, etc.)
- Chinese fonts (Microsoft JhengHei, Microsoft YaHei, SimSun, etc.)
Note: This option is only available when the title is enabled.
Case & Size
- Case: Select the case style for the title text
- Default
- Uppercase
- Lowercase
- Capitalize
- Size: Adjust the title font size (range: 10-128)
Note: This option is only available when the title is enabled.
Font Color
Set the color of the title text. Click the color picker to open the color panel to select a color. Default is #333333.
Text alignment options are provided on the right:
- Left align
- Center align
- Right align
Note: This option is only available when the title is enabled.
Divider
- Enable: Check the checkbox to display a divider between the title and content (enabled by default)
- Color: Set the color of the divider (default is semi-transparent gray rgba(171, 171, 171, 0.36))
- Thickness: Adjust the divider thickness (range: 1-10)
Note: This option is only available when the title is enabled.
General Settings
Time Format
Select the time display format for historical data from the dropdown menu, providing various format options:
Date Only Formats:
- YYYY/MM/DD
- YYYY-MM-DD
- MM/DD/YYYY
- DD.MM.YYYY
- DD/MM/YYYY
- DD-MM-YY
- DD/MM/YY
- MM-DD-YY
Date Time Formats (12-hour):
- YYYY/MM/DD hh:mm:ss a
- YYYY-MM-DD hh:mm:ss a
- MM/DD/YYYY hh:mm:ss a
- DD.MM.YYYY hh:mm:ss a
- DD/MM/YYYY hh:mm:ss a
- DD-MM-YY hh:mm:ss a
- DD/MM/YY hh:mm:ss a
- MM-DD-YY hh:mm:ss a
Date Time Formats (24-hour):
- YYYY/MM/DD HH:mm:ss
- YYYY-MM-DD HH:mm:ss
- MM/DD/YYYY HH:mm:ss
- DD.MM.YYYY HH:mm:ss
- DD/MM/YYYY HH:mm:ss
- DD-MM-YY HH:mm:ss
- DD/MM/YY HH:mm:ss
- MM-DD-YY HH:mm:ss
Time Only Formats:
- hh:mm:ss a (12-hour)
- hh:mm:ss (24-hour, default)
Default Interval
Set the time range displayed when the widget initially loads:
Available Options:
- 1 minute
- 3 minutes
- 5 minutes
- 10 minutes
- 15 minutes
- 30 minutes
- 1 hour
- 6 hours
- 12 hours
- 1 day
- 3 days
- 7 days
- 30 days
- 3 months
- 6 months
- 1 year
Important Note:
- When aggregation is not enabled, the maximum time range is 6 hours (21600 seconds). For detailed limits, refer to the Data Limitations section
Download
Enable
Use the toggle switch to enable or disable the download function for historical data. When enabled, users can export the historical data in the table as a file.
Aggregation
In aggregation mode, values from different data sources can be displayed at the same time point, but there will be deviations from actual values.
Note:
- When switching to "Raw" mode, if the time range exceeds 6 hours (21600 seconds), the system will automatically adjust to 6 hours. For detailed limits, refer to the Data Limitations section
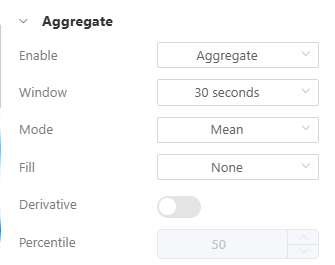
Window Size
Set the time interval for data aggregation:
- 10 seconds
- 30 seconds
- 1 minute
- 5 minutes
- 10 minutes
- 30 minutes
- 1 hour
- 3 hours
- 6 hours
- 12 hours
- 1 day
Important Note:
- Available window sizes will be automatically adjusted based on the time range
- The system will mark inappropriate options and display warning icons
- Inappropriate options will be displayed in gray with warning tooltips
Mode
Method for aggregating data:
- Average: Calculate the average value within the interval
- Sum: Calculate the sum within the interval
- Max: Take the maximum value within the interval
- Min: Take the minimum value within the interval
- Median: Take the median value within the interval
- Percentile: Take the value at the specified percentile
- Count: Count the number of data points within the interval
- Mode: Take the most frequently occurring value within the interval
Fill
Whether to fill values if the aggregated interval data is empty:
- None: No fill
- Linear: Value derived from linear regression
- Note: This option is not available in Mode mode
- Null: Fill with null
- Previous: Use the previous interval value as reference
Dynamic Options Description:
- When Mode is selected as "Mode", the fill options will be automatically adjusted to remove the "Linear" option
Derivative
Calculate rate of change
- When checked, the rate of change of the data will be calculated
- Note: This option is disabled in "Mode" mode
Percentile
Determine the percentile value to use (0-100), supports two decimal places
- Note: Only editable when mode is set to "Percentile"
- This option is disabled in other modes
Update Frequency
Set the frequency for automatic data updates in the widget:
- 30 seconds
- 1 minute
- 5 minutes
- 10 minutes
- 30 minutes
- 1 hour
- 3 hours
- 6 hours
Appearance
Compact Mode
When checked, enables compact display mode to show the historical data table with tighter spacing (enabled by default).
X
Set the horizontal position (X coordinate) of the widget on the dashboard.
- Minimum: Defined by the system
- Maximum: Dynamically calculated based on workspace size and widget width
Y
Set the vertical position (Y coordinate) of the widget on the dashboard.
- Minimum: Defined by the system
- Maximum: Dynamically calculated based on workspace size and widget height
Width
Set the width of the widget.
- Minimum: Minimum pixel width defined by the widget
- Maximum: Defined by the system
- Default: 150
Height
Set the height of the widget.
- Minimum: Minimum pixel height defined by the widget
- Maximum: Defined by the system
- Default: 125
User Restrictions
Object Class
Set the security access class for this widget. Only users with appropriate permissions can view or operate this widget.
Available options:
- None (default, no restrictions)
- Class: A
- Class: B
- Class: C
- Class: D
- Class: E
- Class: F
- Class: G
- Class: H
- Class: I
- Class: J
- Class: K
- Class: L
Hide When Protected
When checked, this widget will be completely hidden when the user lacks access permissions, rather than just being disabled.
Note: This option is only available after setting an object class.
Hide Download When Protected
When checked, the download function will be hidden when the user lacks access permissions.
Note: This option is only available when download is enabled and an object class is set.
Disabled
When checked, disables all interactive functions of this widget.
Note: This option is only available after setting an object class.
Auto Update
In viewing mode, the history chart automatically updates data by default
- When the time range is within the last 6 hours and aggregation mode is not enabled, real-time mode will be used to retrieve data, with update frequency determined by the tag's interval setting
- In other cases, historical mode will be used to retrieve data, with update frequency based on the window size setting. For example, if the window size is 1 minute, it will update once per minute
Data Limitations
To ensure system stability, there are currently limitations on data retrieval. The limitation conditions are as follows:
Single Retrieval Limited to 4320 Data Points
- In real-time mode in the history chart, we use
5 secondsas the unit to retrieve data, which allows a maximum of6 hoursof data
60(seconds) * 60(minutes) * 6(hours) / 5(seconds) = 4320
- If aggregation mode is enabled, we use
window sizeas the unit to retrieve data If the window size is1 minute, then a maximum of3 daysof data can be retrieved
60(seconds) * 60(minutes) * 24(hours) * 3(days) / 60(seconds) = 4320
Single Download Can Fetch a Maximum of 535680 Data Points
- In real-time mode for history charts, we use
5 secondsas the unit to download data, which allows download of up to31 daysof data
60(seconds)*60(minutes)*24(hours)*31(days)/5(seconds) = 535680
- If aggregate mode is enabled, we use
window sizeas the unit to download data If window size is30 seconds, then up to186 daysof data can be downloaded
60(seconds)*60(minutes)*24(hours)*186(days)/30(seconds) = 535680
- but not exceeding
1 yearof data
Workarounds When Encountering Single Retrieval or Download Limits
- Adjust time range to within the limit
- Enable
aggregate mode, and adjustwindow sizeto a larger value, which will reduce the data volume retrieved each time - Retrieve data in segments by dividing the time range into multiple periods, retrieve data for one period at a time, and then merge these data together
Traffic Limitations
Currently, a single HMI is allowed to retrieve and download approximately 100MBytes of data within 15 minutes. Exceeding this limit will cause retrieval or download failures
Published Dashboard Limitations
- Each published dashboard can only request data download once per
1 minute