Trend Chart
Feature Description
- Purpose: Utilizes continuous line segments to plot numerical data stored on the Weincloud server for data analysis.
- Function: Up to 5 address tags can be selected, with a maximum of 10 trend chart widgets per page.
- Download: Viewers can select the desired time range and download corresponding data according to the original settings (whether the aggregate function is enabled).
Note: Data calculated through the aggregate function may differ from actual data.
Style Settings
Data Source
Select the data source to display values. The data source must be configured before publishing the dashboard, otherwise publishing will fail.
Tag Type Restrictions:
- Only supports Int and Float data types
- Historical storage must be enabled for historical data to be available for trend charts
Quantity Restrictions:
- A single trend chart supports up to 5 data sources
- Each page can contain up to 10 trend chart widgets
Tag Filter
Allows viewers to interactively select which data to display.
- Enable: Turn the tag filter function on/off
Basics
Override the settings on the data source page.
Background Color
Set the widget's background color, supports transparency adjustment.
Title
- Enable: Check to display the title
- Title Text: Enter title content (maximum 100 characters)
- Font: Select title font
- Default
- Arial
- Microsoft JhengHei and other system fonts
- Case: Select text case format
- Default
- Uppercase
- Lowercase
- Capitalize
- Size: Font size 10-128
- Font Color: Set title text color
- Alignment: Select text alignment
- Left
- Center
- Right
Separator
- Enable: Check to display separator line below title
- Color: Set separator line color, supports transparency
- Thickness: Set separator line thickness 1-10
Chart
Legend
- Enable: Show/hide legend
- Position: Select legend display position
- Top
- Bottom
- Left
- Right
- Alignment: Legend alignment
- When position is top/bottom:
- Left
- Center
- Right
- When position is left/right:
- Top
- Center
- Bottom
- When position is top/bottom:
- Color: Legend text color
- Font Size: Legend text size 8-72
Style
- Type: Select trend line type
- Basic: Standard line chart
- Stepped: Stepped line chart
- Line Width: Set trend line thickness 1-10
- Point Width: Data point size 0-10
- Set to 0 to hide data points
- Curve Smoothness: Set curve smoothness 0-0.5
- 0: No smoothing, displays as broken lines
- 0.5: Maximum smoothness, displays as smooth curves
- Note: Only available in "Basic" type
Time
Time Range: Select default display time range
- Last 1 minute
- Last 3 minutes
- Last 5 minutes
- Last 10 minutes
- Last 15 minutes
- Last 30 minutes
- Last 1 hour
- Last 6 hours
- Last 12 hours
- Last 1 day
- Last 3 days
- Last 7 days
- Last 30 days
- Last 3 months
- Last 6 months
- Last 1 year
Important Notes:
- When aggregate function is not enabled, maximum time range is 6 hours (21600 seconds), see Data Limitations section for details
- In view mode, time range can be unrestricted, but data retrieval will be batch-processed and line rendering will be slower. Adjusting the time range to reduce data volume is recommended
- The system will automatically adjust incompatible time ranges based on aggregate settings
Time Selection: When enabled, allows users to customize time range
Color: Time axis text color
Font Size: Time axis text size 8-72
Grid Line Color: X-axis grid line color
Y-Axis
- Minimum: Y-axis minimum value
- Maximum: Y-axis maximum value
- Auto-adjust: Automatically adjusts Y-axis range based on data. When checked, minimum and maximum value settings will be ignored
- Color: Y-axis text color
- Font Size: Y-axis text size 8-72
- Grid Line Color: Y-axis grid line color
- Unit: When checked, allows input of unit text, maximum 10 characters
Download
- Enable: Allows users to download trend chart data in CSV format
Aggregate
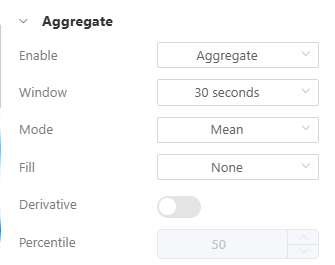
When there are multiple data sources, aggregate mode allows values from different data sources to be plotted at the same time point, but there may be discrepancies with actual values.
Enable
Select data processing mode:
- Aggregate : Enable data aggregation function
- Raw : Display raw data
Note:
- When switching to "Raw" mode, if the time range exceeds 6 hours (21600 seconds), the system will automatically adjust to 6 hours. See Data Limitations section for details
Window Size
Set the time interval for data aggregation:
- 10 seconds
- 30 seconds
- 1 minute
- 5 minutes
- 10 minutes
- 30 minutes
- 1 hour
- 3 hours
- 6 hours
- 12 hours
- 1 day
Important Notes:
- Available window sizes will be automatically adjusted based on the time range
- The system will mark inapplicable options with warning icons
- Inapplicable options will be displayed in gray with warning prompts
Mode
Method of merging data:
- Average: Calculate average value within interval
- Sum: Calculate sum within interval
- Maximum: Take maximum value within interval
- Minimum: Take minimum value within interval
- Median: Take median value within interval
- Percentile: Take value at specified percentile
- Count: Count number of data points within interval
- Mode: Take most frequently occurring value within interval
Fill
Whether to fill values if aggregated interval data is empty (aggregateOption.fill):
- None: No filling
- Linear: Value derived from linear regression
- Note: This option is not available in Mode mode
- Null: Fill with null
- Previous: Use previous interval value as reference
Dynamic Option Description:
- When mode is set to "Mode", the fill options will automatically adjust to remove the "Linear" option
Derivative
Calculate rate of change
- When checked, calculates the rate of change of data
- Note: This option is disabled in "Mode" mode
Percentile
Determine the percentile value to take 0-100, supports two decimal places
- Note: Only editable when mode is set to "Percentile"
- This option is disabled for other modes
Appearance
Compact Mode
When enabled, the widget displays with smaller margins to save space.
Position and Size
- X: Widget X coordinate on canvas
- Y: Widget Y coordinate on canvas
- Width: Widget width
- Height: Widget height
User Restrictions
Object Class
Select the security class for this widget:
- None: No restrictions
- Class A to L: Requires corresponding user permission settings
Hide When Protected
When checked, completely hides this widget if user lacks permission.
Hide Download When Protected
When checked, hides download function if user lacks download permission.
- Note: This option is only effective when "Download" function is enabled
Disabled
When checked, disables widget interaction functions.
Operation Instructions
Viewing Trend Charts
- Use mouse wheel to zoom the chart
- Drag the chart to pan
- Click legend to show/hide specific data lines
- Use time selector to adjust display range
Downloading Data
- Click the download icon, which appears in the bottom right corner of the chart
- Select time range, refer to Data Limitations section
- Select download format (CSV)
- Confirm download
Auto-Update
In view mode, trend charts automatically update data by default
- When time range is within the last 6 hours and aggregate mode is not enabled, real-time mode is used to retrieve data, with update frequency determined by tag interval settings
- In other cases, historical mode is used to retrieve data, with update frequency based on window size settings. For example, if window size is 1 minute, it updates once per minute
Data Limitations
To ensure system stability, there are currently limitations on data retrieval with the following conditions:
Single Retrieval Can Fetch a Maximum of 4320 Data Points
- In real-time mode for trend charts, we use
5 secondsas the unit to retrieve data, which allows retrieval of up to6 hoursof data
60(seconds)*60(minutes)*6(hours)/5(seconds) = 4320
- If aggregate mode is enabled, we use
window sizeas the unit to retrieve data If window size is1 minute, then up to3 daysof data can be retrieved
60(seconds)*60(minutes)*24(hours)*3(days)/60(seconds) = 4320
Single Download Can Fetch a Maximum of 535680 Data Points
- In real-time mode for trend charts, we use
5 secondsas the unit to download data, which allows download of up to31 daysof data
60(seconds)*60(minutes)*24(hours)*31(days)/5(seconds) = 535680
- If aggregate mode is enabled, we use
window sizeas the unit to download data If window size is30 seconds, then up to186 daysof data can be downloaded
60(seconds)*60(minutes)*24(hours)*186(days)/30(seconds) = 535680
- but not exceeding
1 yearof data
Workarounds When Encountering Single Retrieval or Download Limits
- Adjust time range to within the limit
- Enable
aggregate mode, and adjustwindow sizeto a larger value, which will reduce the data volume retrieved each time - Retrieve data in segments by dividing the time range into multiple periods, retrieve data for one period at a time, and then merge these data together
Traffic Limitations
Currently, a single HMI is allowed to retrieve and download approximately 100MBytes of data within 15 minutes. Exceeding this limit will cause retrieval or download failures
Published Dashboard Limitations
- Each published dashboard can only request data download once per
1 minute