AnalyzeData
This feature allows you to gain deeper insights into your data using trend charts and historical data queries.
Feature Location
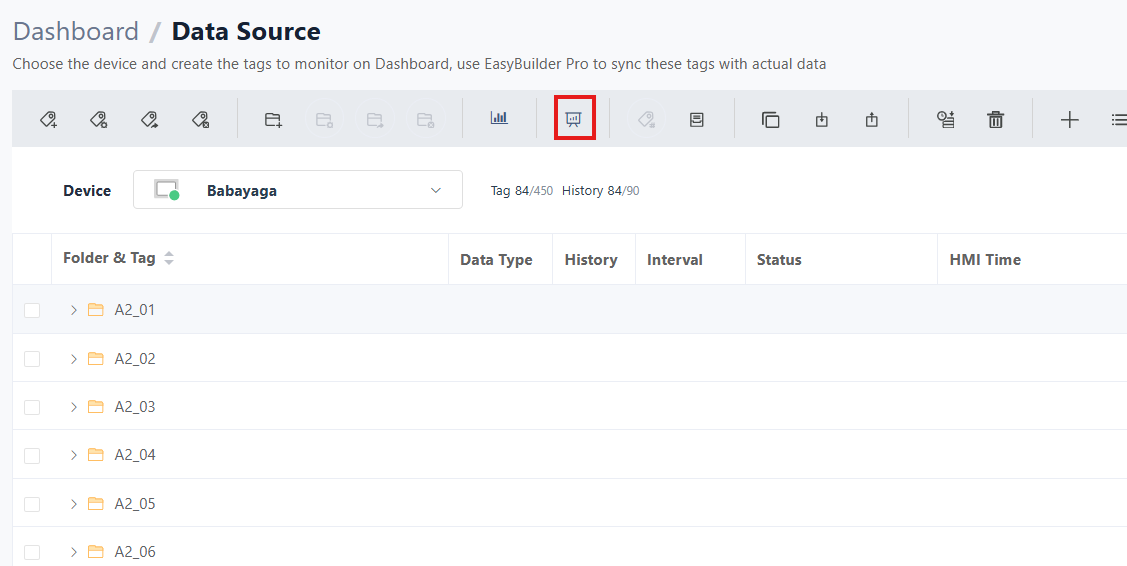
- Click on
Data Sourcein the left menu
- Click on
- Select the
HMIyou want to view
- Select the
- Select the tags you want to analyze below. You can analyze multiple tags together, up to 5 tags maximum
- Click on the
AnalyzeDataicon at the top
- Click on the
Trend Chart
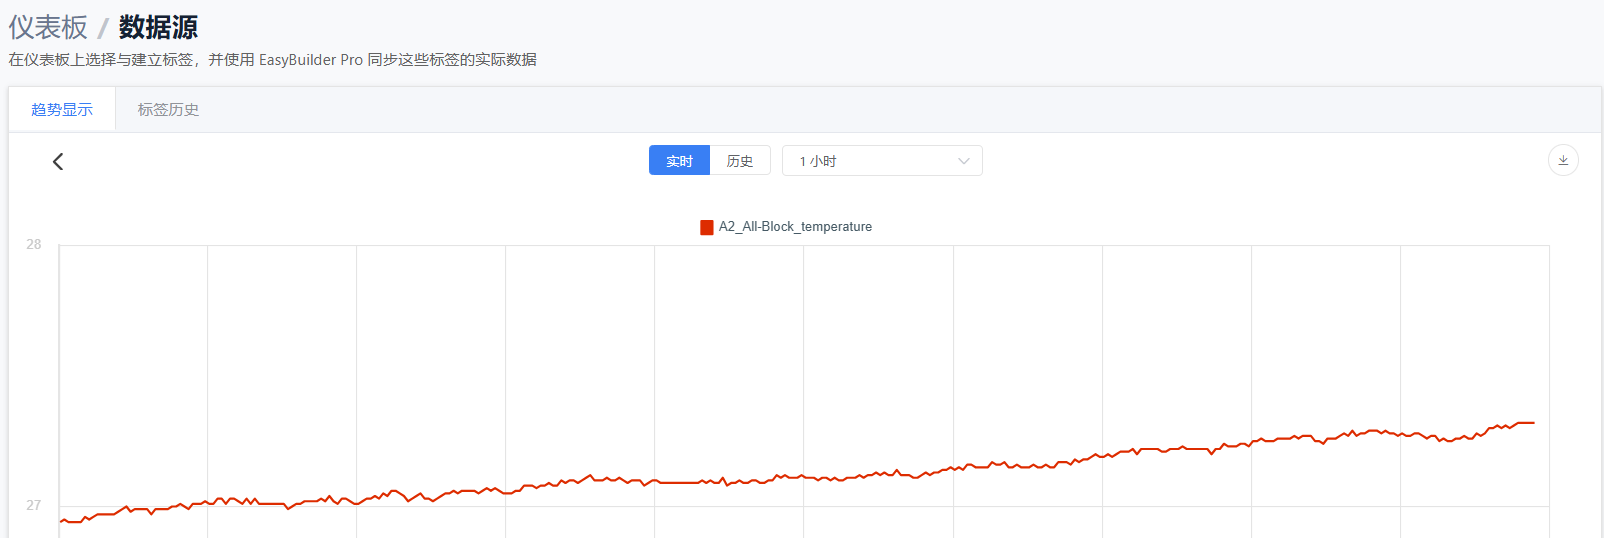
The trend chart allows you to view changes in tags over a period of time. You can select different time ranges to observe data trends.
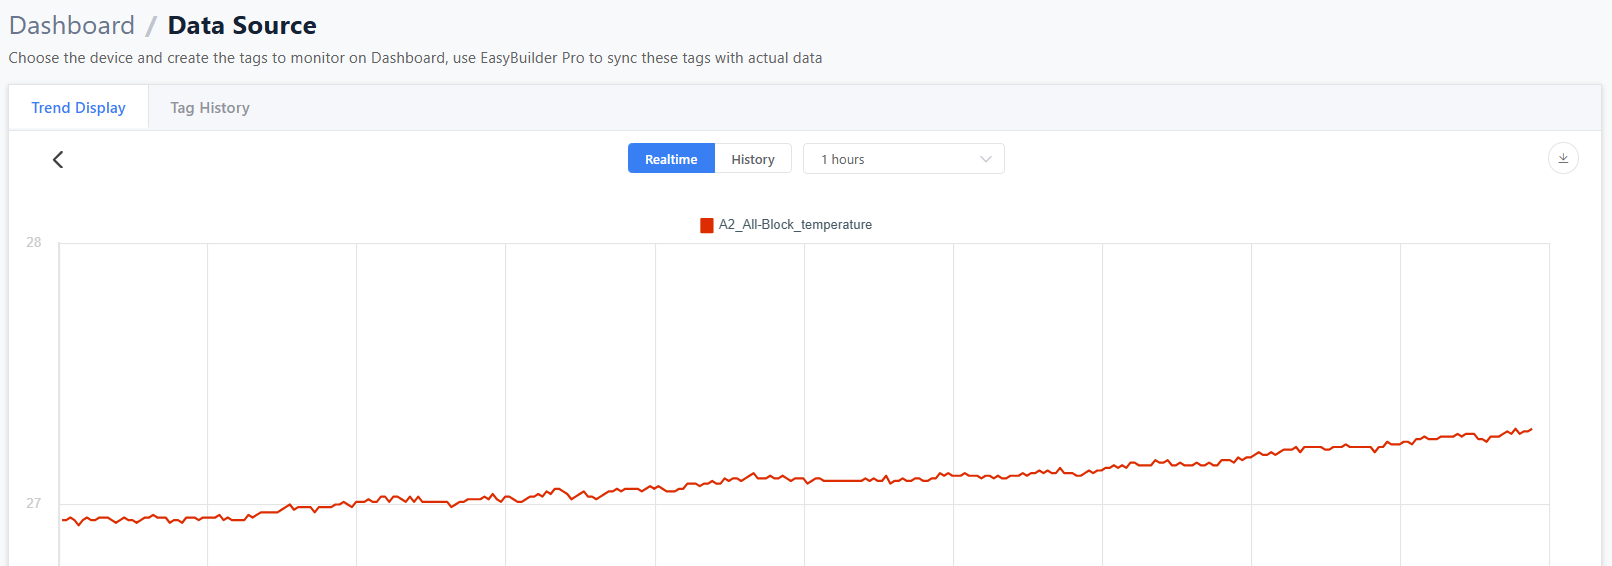
Real-time Mode
Real-time mode allows you to view live data changes for tags. The update frequency depends on the tag's interval setting.
Feature Description
- Time range can be selected up to
6 hoursmaximum
- Time range can be selected up to
- You can use the mouse wheel to zoom in or out on the chart, but it will switch to
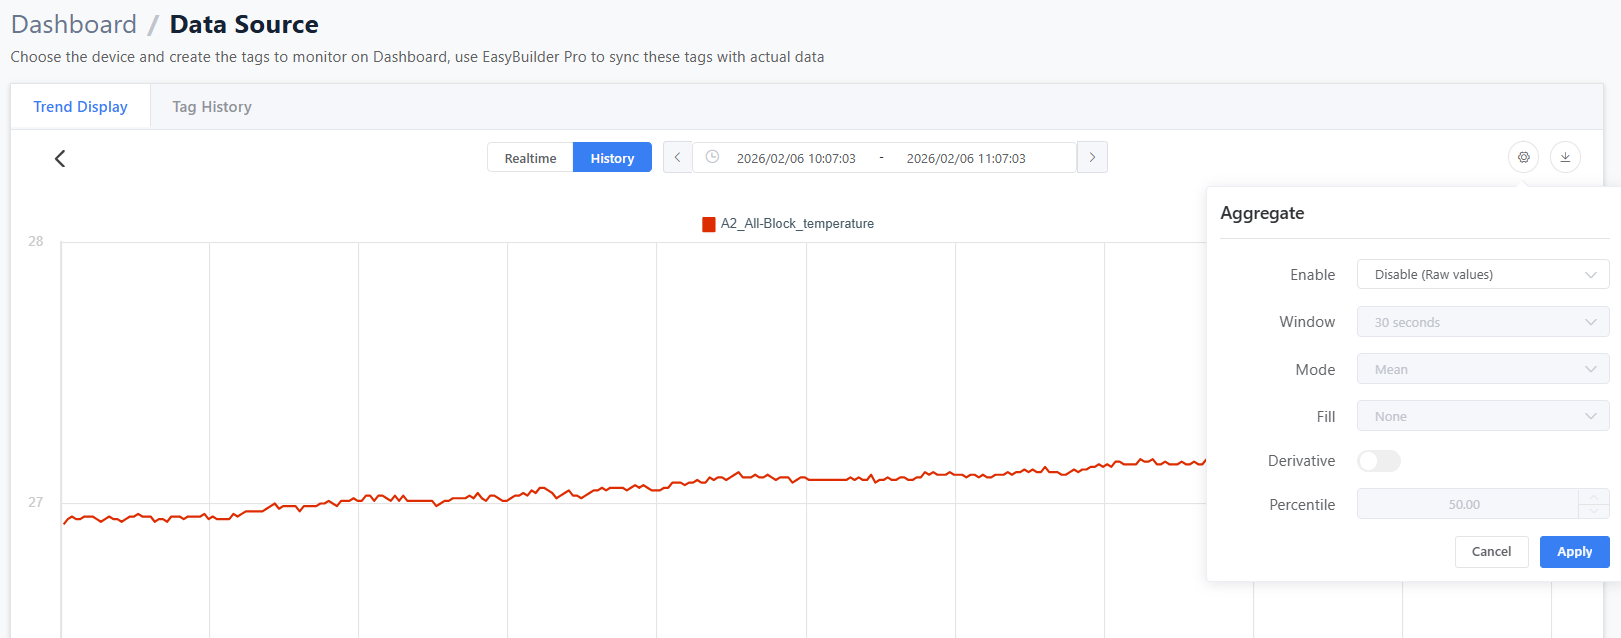
Historical Mode
- You can use the mouse wheel to zoom in or out on the chart, but it will switch to
- You can drag the chart left or right with the mouse to view data at different time points, but it will switch to
Historical Mode
- You can drag the chart left or right with the mouse to view data at different time points, but it will switch to
- You can download raw data from the top right, but it cannot exceed the
Data Limit
- You can download raw data from the top right, but it cannot exceed the
Historical Mode
Historical mode allows you to view historical data for tags within a specific time range. You can select different time ranges to observe data trends.
Feature Description
- Time range can be selected up to
1 yearmaximum
- Time range can be selected up to
- You can use the mouse wheel to zoom in or out on the chart
- You can drag the chart left or right with the mouse to view data at different time points
- You can download raw data from the top right, but it cannot exceed the
Data Limit
- You can download raw data from the top right, but it cannot exceed the
- You can enable
Aggregate Modeto reduce data volume, and select differentwindow sizesto view data trends
- You can enable
- If the time range or window size and other settings exceed the
Data Limit, data will currently be loaded in batches, resulting in slower line rendering. It is recommended to adjust thetime rangeorwindow sizeto reduce data volume
- If the time range or window size and other settings exceed the
Tag History
Tag history allows you to view historical data for tags within a specific time range, displayed in table format.
Feature Description
- Time range can be selected up to
1 yearmaximum
- Time range can be selected up to
- You can download raw data from the top right, but it cannot exceed the
Data Limit
- You can download raw data from the top right, but it cannot exceed the
- You can enable
Aggregate Modeto reduce data volume, and select differentwindow sizesto view data trends
- You can enable
- If the time range or window size and other settings exceed the
Data Limit, you need to adjust thetime rangeorwindow sizeto reduce data volume
- If the time range or window size and other settings exceed the
Aggregate
When there are multiple data sources, aggregate mode allows values from different data sources to be plotted at the same time point, but there may be discrepancies with actual values.
Window Size
Set the time interval for data aggregation:
- 10 seconds
- 30 seconds
- 1 minute
- 5 minutes
- 10 minutes
- 30 minutes
- 1 hour
- 3 hours
- 6 hours
- 12 hours
- 1 day
Important Notes:
- Available window sizes will be automatically adjusted based on the time range
- The system will mark inapplicable options with warning icons
- Inapplicable options will be displayed in gray with warning prompts
Mode
Method of merging data:
- Average: Calculate average value within interval
- Sum: Calculate sum within interval
- Maximum: Take maximum value within interval
- Minimum: Take minimum value within interval
- Median: Take median value within interval
- Percentile: Take value at specified percentile
- Count: Count number of data points within interval
- Mode: Take most frequently occurring value within interval
Fill
Whether to fill values if aggregated interval data is empty (aggregateOption.fill):
- None: No filling
- Linear: Value derived from linear regression
- Note: This option is not available in Mode mode
- Null: Fill with null
- Previous: Use previous interval value as reference
Dynamic Option Description:
- When mode is set to "Mode", the fill options will automatically adjust to remove the "Linear" option
Derivative
Calculate rate of change
- When checked, calculates the rate of change of data
- Note: This option is disabled in "Mode" mode
Percentile
Determine the percentile value to take 0-100, supports two decimal places
- Note: Only editable when mode is set to "Percentile"
- This option is disabled for other modes
Data Limit
To ensure system stability, there are currently restrictions on data retrieval for certain uses. The restriction conditions are as follows:
Maximum of 4320 data points can be retrieved in a single request
- In real-time mode of the trend chart, we use
5 secondsas the unit to retrieve data, so you can retrieve up to6 hoursof data at most
60(seconds)*60(minutes)*6(hours)/5(seconds) = 4320
- If aggregate mode is enabled, we use
window sizeas the unit to retrieve data If the window size is1 minute, then you can retrieve up to3 daysof data at most
60(seconds)*60(minutes)*24(hours)*3(days)/60(seconds) = 4320
Actions to take when encountering single retrieval limits
- Adjust the time range to within the limit
- Enable
Aggregate Modeand adjust thewindow sizeto a larger value, which will reduce the amount of data retrieved each time - Retrieve data in segments, divide the time range into multiple segments, retrieve data for one segment at a time, and finally merge these data
Traffic Limit
Currently, a single HMI can only retrieve approximately 100MBytes of data within 15 minutes. Exceeding this limit will result in retrieval failure